InDev GeniusbySomeoneVisualizing Global Temperature Trends and Climate Change Patterns (Matplotlib Series Conclusion)Note: To follow along with this blog, please download the dataset from my GitHub repository —…Oct 18, 2024Oct 18, 2024
InDev GeniusbySomeoneInteractive Plotting with Matplotlib: Creating a Frequency SliderIn this blog, we will explore how to create an interactive plot using Matplotlib and a slider widget. This example demonstrates the use of…Oct 17, 2024Oct 17, 2024
InDev GeniusbySomeoneCreating a Sinusoidal Wave Animation Using Matplotlib and FuncAnimationIn this blog, we will explore how to create a sinusoidal wave animation using Matplotlib’s FuncAnimation. This tutorial covers each step of…Oct 16, 2024Oct 16, 2024
InDev GeniusbySomeoneVisualizing Data with Matplotlib: Understanding Colormaps and MeshgridsIn this blog, we will walk through a series of visualizations using Matplotlib and NumPy, showcasing how to effectively create and…Oct 15, 2024Oct 15, 2024
InDev GeniusbySomeoneVisualizing Dates in Matplotlib: Enhancing Time-Series PlotsImporting Required LibrariesOct 14, 2024Oct 14, 2024
InDev GeniusbySomeoneUnderstanding Interactive Plotting in MatplotlibThis blog will explain how to create interactive plots in Matplotlib using the code provided. We’ll break down each part of the code…Oct 13, 2024Oct 13, 2024
InDev GeniusbySomeoneVisualizing Data in Matplotlib: Exploring Different Plot StylesUnderstanding the Code: A Step-by-Step ExplanationOct 13, 2024Oct 13, 2024
InDev GeniusbySomeonePlotting Sine and Cosine Waves with Matplotlib: Adding Legends and Saving FiguresIn this blog, we will break down a program that uses matplotlib to plot sine and cosine waves, add a legend to the figure, and then save…Oct 12, 2024Oct 12, 2024
InDev GeniusbySomeoneUnderstanding Matplotlib Code with LaTeX Annotations: Enhancing Your PlotsImporting Necessary LibrariesOct 12, 2024Oct 12, 2024
InDev GeniusbySomeoneCreating Interactive and Annotated Plots in MatplotlibMatplotlib is a versatile library for creating data visualizations in Python. In this 26th blog of our Matplotlib series, we’ll explore how…Oct 11, 2024Oct 11, 2024
InDev GeniusbySomeoneUnderstanding Vector Field Plots with Matplotlib’s Quiver FunctionIn this blog, we will delve into creating vector field plots using Matplotlib’s quiver function. We’ll go through the code step-by-step to…Oct 10, 2024Oct 10, 2024
InDev GeniusbySomeoneCreating Polar Plots Using Matplotlib and NumPyIn this blog, we will explore how to create polar plots using Matplotlib and NumPy. This marks my 24th blog on my journey with Matplotlib…Oct 9, 2024Oct 9, 2024
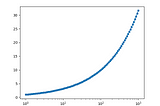
InDev GeniusbySomeoneUnderstanding Logarithmic Plots in Matplotlib: semilogx, semilogy, and loglogIn this blog, we will explore how to use various logarithmic plotting functions in Matplotlib to visualize data effectively. This example…Oct 8, 2024Oct 8, 2024
InDev GeniusbySomeoneExploring 3D Plotting with Matplotlib: Surface, Scatter, and Wireframe PlotsUnderstanding 3D Plotting with MatplotlibOct 7, 2024Oct 7, 2024
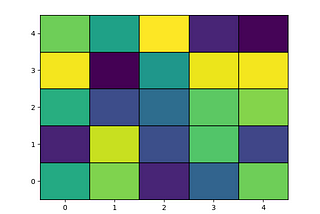
InDev GeniusbySomeoneVisualizing Heatmaps with pcolormesh in MatplotlibIn this blog, we will explore how to create heatmaps using the pcolormesh function in Matplotlib. This method allows for detailed…Oct 6, 2024Oct 6, 2024
InDev GeniusbySomeoneUnderstanding Heatmaps in Matplotlib with Custom ColormapsIn this blog, we will explore how to create heatmaps using matplotlib in Python. Specifically, we’ll cover two different heatmaps — one…Oct 6, 2024Oct 6, 2024
InDev GeniusbySomeoneCreating Error Bar Plots in Matplotlib: Visualizing Data with UncertaintyIn this blog, we will explore the process of creating error bar plots using Matplotlib. Error bars are a great way to represent the…Oct 5, 2024Oct 5, 2024
InDev GeniusbySomeoneUnderstanding Boxplots in MatplotlibIn this blog, we will explore how to create boxplots in Matplotlib using the plt.boxplot() function. Boxplots, also known as…Oct 4, 2024Oct 4, 2024
InDev GeniusbySomeoneExploring Pie Charts with MatplotlibMy Program — Pie ChartsOct 4, 2024Oct 4, 2024
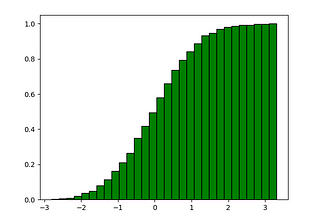
InDev GeniusbySomeoneCreating Histograms in MatplotlibIntroduction to Histograms in MatplotlibOct 3, 2024Oct 3, 2024